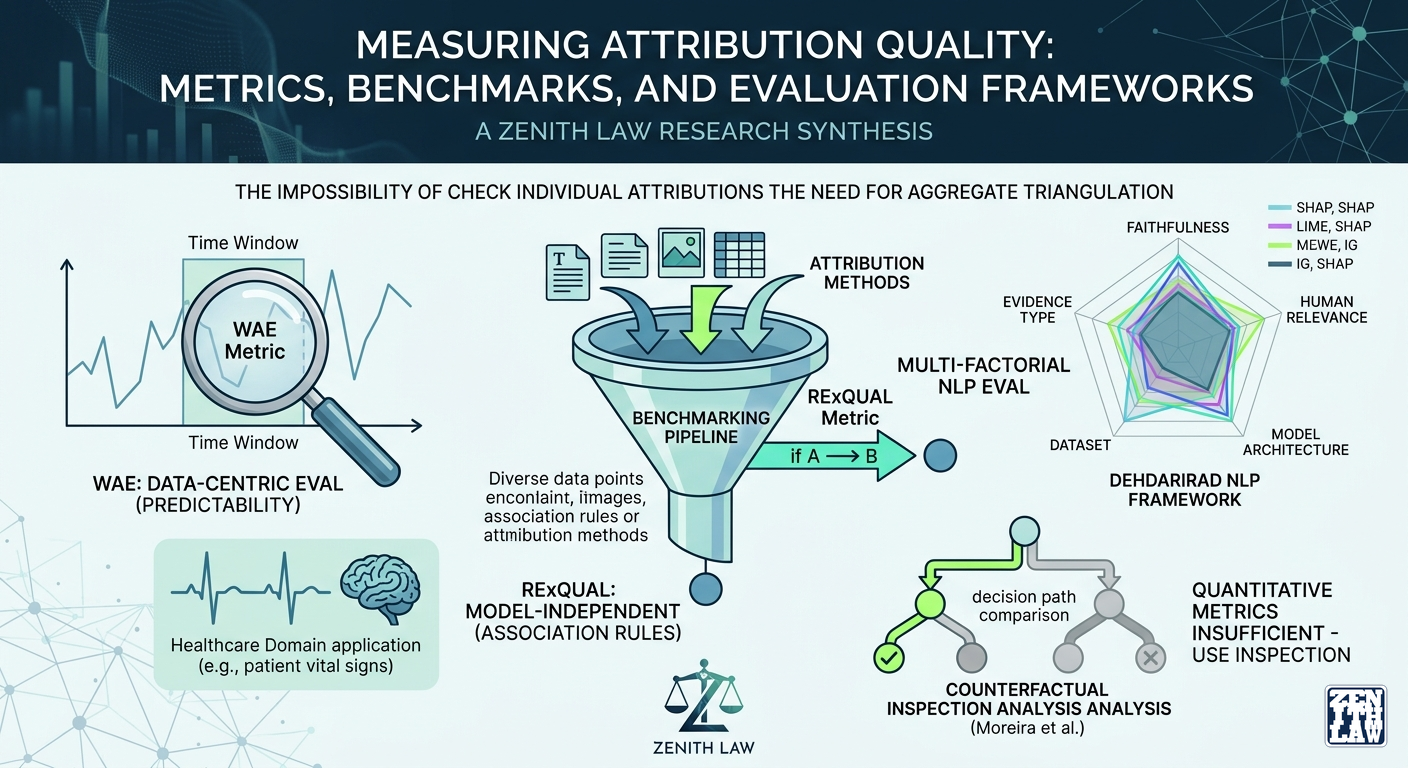
If standard attribution methods cannot be verified for individual cases without model adaptation, how should they be evaluated? The answer is aggregate benchmarking, but the literature disagrees on both the metrics and the methodology. WAE evaluates attributions against data-inherent properties rather than model behaviour. RExQUAL uses association rules to quantify explanation quality for time series. The counterfactual benchmark by Moreira et al. reveals that standard evaluation metrics are insufficient and decision-path inspection is necessary. Dehdarirad's unified framework shows that attribution faithfulness is conditional on model architecture, dataset, and evidence type, with no universal best method. Together, these papers define the current state and limits of attribution evaluation.
Introduction
If individual attributions cannot be verified without model adaptation, how do we know which method to use? The answer that the field offers is aggregate benchmarking: evaluate across many examples and compute summary metrics. But which metrics should we trust? All of them measure proxies for ground truth, and each proxy has blind spots.
The four papers in this review approach the evaluation problem from different directions. Chen and Zhang argue for data-centric evaluation that avoids the circularity of perturbation-based metrics. Troncoso-García et al. propose association rules as a model-independent quality measure for time series. Moreira et al. run the largest counterfactual benchmark to date and conclude quantitative metrics alone are broken. Dehdarirad demonstrates that attribution faithfulness is conditional on model type, dataset, and evidence polarity, with no universal best method.
Each metric is examined below: what it actually measures, where it breaks, and how to combine metrics so their blind spots do not overlap.
This article is not legal advice.
Evaluation and Metrics Glossary
- Faithfulness metric
- A quantitative measure of how accurately an attribution reflects the actual decision process of the model, typically computed by perturbing features and measuring the correlation between attribution scores and prediction changes.
- Counterfactual explanation
- A minimal change to the input that would change the prediction of the model, answering the question "what would need to be different for this outcome to change?" rather than "which features were important for this outcome?"
- Decision-path inspection
- A qualitative evaluation method that examines the actual decision rules a model uses (e.g., tree paths) and compares them against the features highlighted by attribution methods, revealing mismatches that quantitative metrics miss.
- AOPC (Area Over the Perturbation Curve)
- A faithfulness metric that measures how quickly the prediction of the model changes when features are removed in order of decreasing attribution importance, with steeper drops indicating more faithful attributions.
- Association rule
- A discovered pattern of the form "if features A and B have certain values, then the prediction is C" with associated metrics for support (frequency) and confidence (reliability), used by RExQUAL to evaluate explanation quality.
- Ground-truth proxy
- An indirect measure used as a substitute for true feature importance when ground truth is unavailable, such as using data predictability as a proxy for which features matter in a forecasting task.
Four Approaches to the Evaluation Problem
Chen and Zhang (2025): Data-Centric Evaluation with WAE
Perturbation-based faithfulness metrics are circular: they evaluate an attribution method using the same model it is trying to explain. [1] WAE (Window-based Attribution RMSE) breaks this circle by comparing attributions against a data-inherent property: the predictability of each time window, measured via real entropy. The intuition is that more predictable windows are driven by stronger signals, and an attribution method should assign higher importance to features in those windows. The RMSE between the attribution ranking and the predictability ranking is the WAE score. The circularity critique is valid, but the alternative that WAE proposes replaces one proxy (model behaviour) with another (predictability as ground truth), and the relationship between data predictability and feature importance is itself an untested assumption. A feature that drives predictability may not be the same as a feature the model actually uses. WAE is a step forward in independence from the model, but it does not eliminate the proxy problem.
Two validation hypotheses are confirmed: more advanced methods (SHAP, LEMNA) achieve lower WAE than simpler ones (LIME), and more interpretable datasets yield lower WAE. WAE remains valid even when the model has known OOD sensitivity, which is the critique that undermines perturbation-based metrics.
Core trade-off: WAE assumes a specific relationship between data predictability and feature importance that may not hold for all domains or tasks.
Study limitations: The data-centric framing addresses a real vulnerability in existing metrics. The two validation hypotheses are confirmed on the experimental setup of the paper. The core assumption, that predictability is a valid proxy for importance, lacks independent evidence linking it to human-judged feature relevance.
Troncoso-García et al. (2025): Model-Independent Evaluation with RExQUAL
RExQUAL evaluates attribution quality against discovered association rules rather than against the model or the data directly. [3] The metric works in four stages: train the model and generate attributions, extract key features via the elbow method, run Apriori association rule mining, and compute RExQUAL as confidence × support × (feature coverage fraction). It measures how well the features identified by an attribution method support the generation of high-quality rules matching the behaviour of the model.
On Spanish electric demand and SAGRA evapotranspiration datasets, RULEx achieves the highest RExQUAL (0.876), followed by SHAP. LIME performs worse than random, suggesting its linear-surrogate approach is fundamentally unsuited to time series. A striking anomaly: on multivariate SAGRA, SHAP underperforms random feature selection (0.251 vs 0.482). This suggests the attributions of SHAP may be actively misleading for multivariate time series.
Study limitations: The RExQUAL framework provides a genuinely novel paradigm. The finding that LIME underperforms random selection on time series is a strong empirical result. The independence of the metric from model-specific validation requires further confirmation: the association rule quality metrics (support, confidence) need validation against human judgement.
Moreira et al. (2025): The Counterfactual Benchmark and Its Broken Metrics
One of the largest counterfactual benchmarks to date evaluates four algorithms across three model types on 25 tabular datasets (the authors describe it as the most extensive in the field). [2] Three findings stand out. First, model type has no significant impact on counterfactual quality: counterfactual algorithms adapt to whatever boundary the model has learned. This finding challenges the common assumption that simpler models yield better explanations, but only for counterfactuals. It has not been tested whether attribution methods show the same model-type independence. Second, quantitative metrics alone cannot distinguish plausible from implausible explanations. WatcherCF optimises for minimum proximity but can produce absurd counterfactuals (Age changing from 34 to 81); the quantitative metric says high quality, decision-path inspection reveals implausibility. Third, DiCE achieves the best practical balance through explicit diversity and plausibility constraints.
The authors also observe that the counterfactual XAI field faces an incipient replication crisis: no standardised evaluation framework, no common benchmark datasets, and no consensus on which metrics matter. This diagnosis applies beyond counterfactuals to the broader attribution evaluation literature.
Key insight: Counterfactual algorithms are always faithful to their model. The question is whether the counterfactual is plausible, not whether it is valid.
Study limitations: The finding that model type does not affect counterfactual quality is statistically robust across 25 datasets. The demonstration that quantitative-only evaluation is broken is empirically convincing. Generalisability to non-tabular data is unconfirmed.
Dehdarirad (2025): A Multi-Factorial Framework for NLP Attribution
Most evaluation studies compare methods on a single metric and a single task, generating claims that do not generalise. [4] This controlled multi-factorial experiment compares SHAP, LIME, and Integrated Gradients across classical models (Logistic Regression, Random Forest), transformer models (DistilBERT, RoBERTa), three binary text datasets, positive and negative evidence types, and both automated and human metrics.
Three findings emerge. First, no universal best method exists: SHAP excels for classical models with positive evidence, while LIME matches or beats SHAP on complex transformers for negative evidence. Second, model scale does not monotonically improve explainability: DistilBERT produces more faithful attributions than RoBERTa despite being smaller and less accurate. Third, human evaluation reveals patterns automated metrics miss; the correlation between automated faithfulness scores and human relevance ratings is modest.
Implication: Evaluation results are conditional on model architecture, dataset, and evidence type. Single-number rankings conceal more than they reveal.
Study limitations: The multi-factorial design provides strong evidence that attribution faithfulness is conditional on these factors. Generalisability beyond English text classification to multilingual, multimodal, or regression tasks is unconfirmed.
Cross-Paper Synthesis: The State of Attribution Evaluation
Domain fragmentation: a caveat on synthesis
The four papers in this review come from different domains (time series, tabular, NLP text), each with task-specific evaluation assumptions. A practitioner working on NLP attribution will not directly benefit from the time-series-specific findings of WAE or RExQUAL, and vice versa. The synthesis below treats them as a shared research space, but the field lacks studies that apply multiple evaluation paradigms to the same datasets and methods. Until such convergent validity work is done, cross-domain generalisation of evaluation findings remains speculative.
The evaluation crisis is real and structural
All four papers converge on a sobering conclusion: current evaluation methodology is insufficient. Chen and Zhang show that model-centric metrics have a circular dependency problem. Troncoso-García et al. offer an alternative but acknowledge it requires further validation. Moreira et al. prove that quantitative metrics alone are broken. Dehdarirad shows that evaluation results are highly conditional on experimental choices.
The structural problem is that attribution evaluation requires a ground truth that is definitionally unavailable for real-world tasks. The impossibility result established by Bhalla et al. for unmodified black-box models is not just a theoretical curiosity. It cascades into the evaluation literature, which must resort to proxies, perturbations, or human judgement, each with its own limitations.
Three families of evaluation metrics
The papers define three distinct evaluation paradigms, each with different guarantees and limitations:
| Paradigm | Examples | Ground truth | Limitation |
|---|---|---|---|
| Model-centric | AOPC, log-odds, insertion/deletion | Model behaviour under perturbation | OOD sensitivity; circular dependency |
| Data-centric | WAE | Data predictability | Assumes predictability = importance |
| Discovery-centric | RExQUAL | Association rules | Requires validation of rule quality |
| Human-centric | User studies, relevance ratings | Human judgement | Expensive; hard to replicate |
This finding challenged my own assumption that simpler, more theoretically grounded methods always produce better explanations. The truth is messier: method performance depends on what you are explaining, with what model, and for whom. There is no shortcut around conditional testing.
The convergent validity gap
An open question across all four papers is whether the different evaluation paradigms converge on the same ranking of methods. Dehdarirad’s finding of modest correlation between automated and human metrics suggests they may not. The papers do not compare WAE, RExQUAL, AOPC, and human ratings on the same datasets with the same methods. Without such a comparison, we cannot know whether a method that scores well on WAE also scores well on RExQUAL or human evaluation. Convergent validity studies, where multiple metrics from different paradigms are applied to the same experimental setup, are the most urgently needed work in attribution evaluation.
Practical implications
- Triangulate: No single metric is sufficient. Practitioners should use at least two metrics from different paradigms.
- Domain matters: Dehdarirad’s findings suggest evaluation results may not transfer across domains or architectures.
- Inspecting > scoring: the decision-path inspection of Moreira et al. should be a standard complement to quantitative evaluation, especially in high-stakes settings.
- Time series needs dedicated treatment: Both WAE and RExQUAL were developed specifically for time series, and LIME specifically underperforms in this domain.
Questions on Attribution Evaluation
Can WAE and RExQUAL be used together?
Yes, they measure different things. WAE evaluates against data properties; RExQUAL evaluates against discovered rules. A method that scores well on both provides convergent evidence of quality.
Does the finding of Moreira et al. about model type generalise beyond counterfactuals?
It has not been tested for attribution methods. The finding that different architectures learn similar patterns on well-represented data is plausible for attribution as well, but the counterfactual-specific nature of the benchmark means direct extrapolation is speculative.
Is there a standardised benchmark suite for attribution evaluation?
No. The papers reviewed here suggest why: domain, architecture, and task interact too strongly for a single benchmark to be universally informative. The field is moving toward task-specific evaluation suites rather than a single leaderboard.
How should a practitioner choose between evaluation metrics?
Start by asking: what kind of failure matters most? If false positive attributions (highlighting irrelevant features) are the main risk, use precision-oriented metrics. If false negatives (missing important features) are worse, use recall-oriented metrics or human evaluation. No single metric captures both.
Does human evaluation correlate with automated metrics?
Dehdarirad’s results show modest correlation, suggesting that human and automated metrics capture partially overlapping but distinct constructs. Automated metrics are cheaper and more reproducible; human evaluation is necessary for deployment decisions that affect end users.
Conclusion
Every evaluation paradigm relies on a proxy for ground truth, and every proxy has blind spots. Perturbation-based metrics break when the model is OOD-sensitive. Data-centric metrics assume predictability equals importance. Rule-based metrics depend on the quality of discovered associations. Human evaluation is expensive and noisy. The solution is not to pick the best proxy but to combine proxies whose blind spots do not overlap.
The most productive direction is not a new metric. It is a systematic understanding of when existing metrics disagree and why. A forthcoming article on causal attribution examines whether the methods themselves can escape the correlational trap that metrics are trying to measure.
Part 3 of a series on feature attribution, explainability, and interpretability. Technical and educational content. Not legal, regulatory, or procurement advice. Claims bounded to the results reported in the cited papers unless explicitly stated otherwise.
Technical Appendix
Appendix Table of Contents
- Author and Source Credibility
- Corpus Reviewed
- Citability Snapshot
- Technical Term Definitions
- Metric Comparison Matrix
- Evidence Maturity Map
Author and Source Credibility
All four papers appear in established venues: Neurocomputing (Chen & Zhang), TPAMI (IEEE, Troncoso-García), ACM Computing Surveys (Moreira), Data and Information Management (Dehdarirad). Venue quality ranges from top journal (TPAMI, ACM Computing Surveys) to mid-tier (Neurocomputing, Data and Information Management).
Corpus Reviewed
- Chen, Y. and Zhang, S. (2025) ‘WAE: an evaluation metric for attribution-based XAI on time series forecasting’, Neurocomputing, 622, 129379. doi:10.1016/j.neucom.2025.129379.
- Troncoso-García, Á.R., Martínez-Ballesteros, M., Martínez-Álvarez, F. and Troncoso, A. (2025) ‘A new metric based on association rules to assess feature-attribution explainability techniques for time series forecasting’, IEEE Transactions on Pattern Analysis and Machine Intelligence, 47(5), 4140 to 4155. doi:10.1109/TPAMI.2025.3540513.
- Moreira, C., Chou, Y.-L., Hsieh, C., Ouyang, C., Pereira, J. and Jorge, J. (2025) ‘Benchmarking instance-centric counterfactual algorithms for XAI: from white box to black box’, ACM Computing Surveys, 57(6), Article 145. doi:10.1145/3672553.
- Dehdarirad, T. (2025) ‘Evaluating explainability in language classification models: a unified framework incorporating feature attribution methods and key factors affecting faithfulness’, Data and Information Management, 9, 100101. doi:10.1016/j.dim.2025.100101.
Citability Snapshot
| Criterion | WAE | RExQUAL | Counterfactual | Dehdarirad |
|---|---|---|---|---|
| Methodology | Data-centric metric | Association-rule metric | Empirical benchmark | Multi-factorial eval |
| Venue | Neurocomputing | TPAMI | ACM Comput. Surv. | DIM |
| Empirical breadth | Multiple TS datasets | 2 TS datasets | 25 datasets × 4 methods | 3 datasets × 3 methods |
| Domain focus | Time series | Time series | Tabular (general) | NLP text |
| Human eval | No | No | No | Yes (100 raters) |
Technical Term Definitions
- Real entropy
- A measure of the inherent unpredictability of a time series, with lower entropy indicating more predictable windows that are argued to be driven by stronger underlying signals.
- Elbow method
- A heuristic for selecting the number of key features from an attribution ranking by identifying the point where the slope of the cumulative importance curve changes most sharply.
- Apriori algorithm
- A classic association rule mining algorithm that identifies frequent itemsets and generates rules with confidence above a threshold, used by RExQUAL to extract rule-based explanations from attribution results.
- Log-odds deletion metric
- A faithfulness metric that measures the change in log-odds of the predicted class as features are removed in order of decreasing importance, quantifying how much each feature contributes to the prediction confidence.
- Plausibility (in counterfactuals)
- The degree to which a counterfactual example could occur in the real world, as opposed to merely satisfying the mathematical constraint of changing the prediction of the model.
Metric Comparison Matrix
| Property | WAE | RExQUAL | AOPC/Log-odds | Decision-path |
|---|---|---|---|---|
| Evaluates against | Data entropy | Association rules | Model perturbation | Model structure |
| Model access needed | None | None | Predictions | White-box |
| Domain specificity | Time series | Time series | Any | Tree models |
| Human interpretability | Medium | High (as rules) | Low | High |
| Computational cost | Low (estimates only) | Medium (Apriori) | Low | None |
Evidence Maturity Map
- Strong empirical evidence (replicated across settings): (a) Model type has no significant effect on counterfactual quality (Moreira); (b) SHAP outperforms LIME on most tabular benchmarks (Dehdarirad, Moreira).
- Demonstrated on limited settings: (a) WAE validation on time series datasets; (b) RExQUAL on two energy datasets; (c) Dehdarirad’s full multi-factorial results.
- Partial or contradictory evidence: LIME performing worse than random on time series (Troncoso-García) vs. acceptable performance on NLP (Dehdarirad).
- Inferred synthesis: (a) Generalisability of Moreira’s findings to attribution (not counterfactual) methods; (b) transferability of evaluation results across domains.
References
- [1]Y. Chen and S. Zhang, WAE: An evaluation metric for attribution-based XAI on time series forecasting, vol. 622, pp. 129379, 2025. doi: 10.1016/j.neucom.2025.129379. Accessed: 18 June 2026.
- [2]C. Moreira, Y. L. Chou, C. Hsieh, C. Ouyang, J. Pereira and J. Jorge, Benchmarking Instance-Centric Counterfactual Algorithms for XAI: From White Box to Black Box, vol. 57, no. 6, n.d. doi: 10.1145/3672553. Accessed: 18 June 2026.
- [3]Á. R. Troncoso-García, M. Martínez-Ballesteros, F. Martínez-Álvarez and A. Troncoso, A New Metric Based on Association Rules to Assess Feature-Attribution Explainability Techniques for Time Series Forecasting, vol. 47, no. 5, pp. 4140–4155, n.d. doi: 10.1109/TPAMI.2025.3540513. Accessed: 18 June 2026.
- [4]T. Dehdarirad, Evaluating explainability in language classification models: A unified framework incorporating feature attribution methods and key factors affecting faithfulness, vol. 9, no. 4, pp. 100101, 2025. doi: 10.1016/j.dim.2025.100101. Accessed: 18 June 2026.
Continue Reading in This Series
These linked articles extend the same evidence trail and improve navigability for readers and search systems.