Four articles. Fifteen core papers. Diverse domains. This final article in the series translates the research into practice: how to select an attribution method given your model type, domain, and accountability requirements; how to integrate attribution into ML pipelines; and what governance structures are needed to ensure explanations serve their intended purpose. The synthesis draws on Kost et al.'s XAI-guided feature selection framework, domain applications from energy forecasting to medical imaging, and four major surveys that establish the broader XAI literature. The message is pragmatic: feature attribution is too immature for universal standards, too important to ignore, and too domain-dependent for one-size-fits-all guidance.
Introduction
Four articles established what feature attribution can and cannot deliver: individual attributions from black-box models cannot be verified; exact computation is possible for specific architectures; no single evaluation metric is sufficient; standard methods conflate association with causation. The practitioner’s question follows: what should you actually do?
The answer is not a single recommendation. It is a decision framework organised around the variables that matter: model access, domain stakes, regulatory requirements, computational budget, and stakeholder needs. The synthesis draws on Kost et al.’s XAI-guided feature selection framework as a worked example, a distillation of domain applications, and the major XAI surveys that establish context.
This article is not legal advice.
Operational and Governance Vocabulary
- Feature governance
- The organisational practice of documenting, monitoring, and controlling which features are used in ML models, including periodic review of feature relevance, data quality, and drift.
- Dominance index
- A Herfindahl-Hirschman-based measure of how concentrated feature importance is, where high dominance indicates that a single feature drives most of the model's predictive power.
- Model documentation
- The practice of producing structured metadata about a model's intended use, training data, evaluation results, and limitations, formalised by Mitchell et al. (2019) [2] as Model Cards.
- Stakeholder-appropriate explanation
- An explanation whose complexity, format, and content match the intended audience's technical expertise and decision-making needs, as opposed to a single explanation format for all audiences.
- Cost-aware feature selection
- Feature selection that accounts for the acquisition cost of each feature, not just its predictive contribution, enabling trade-offs between model performance and operational expense.
A Worked Example: Kost, Lier and Breitner (2025)
The XAI-FS framework by Kost et al. is the only paper in the selected set that directly addresses how attribution methods should be used within an ML development pipeline [1]. It is therefore the natural starting point for practice-oriented synthesis.
The scenario is a photovoltaic energy forecasting task with 15 features where Global Horizontal Irradiance dominates. The practitioner has two concerns: whether overdependence on GHI creates brittleness, and whether features can be removed to reduce data acquisition costs. The XAI-FS pipeline trains the model and computes attributions (SHAP, ELI5), computes a Herfindahl-Hirschman-based dominance index (GHI scores 0.365, indicating high concentration), tags each feature with acquisition cost, applies a multi-objective decision function balancing accuracy, dominance, and cost, and recommends feature removal. Removing GHI reduces R² from 0.943 to 0.934 while cutting dominance to 0.169 and improving noise robustness.
The framework turns attribution into a design-stage governance tool: the question becomes not “did the model predict correctly?” but “is the model’s feature reliance healthy?”
Scope: Validated on a single dataset with gradient boosting only. Uses SHAP and ELI5 but not the newer methods reviewed in this series. The dominance index does not capture interaction effects or dynamic importance under distribution shift. The framework also does not address how attribution-based feature selection interacts with regulatory requirements such as the EU AI Act’s transparency obligations, which may mandate retention of specific features for explainability regardless of predictive importance.
Domain Applications: What the Wider Literature Shows
The tier 3 papers in the selection analysis apply attribution methods to specific domains. While none is a standalone methodological contribution, together they reveal patterns about how attribution works in practice.
Energy and climate (most represented)
The largest domain cluster is energy and climate forecasting, with five papers applying SHAP to wind, solar, heating load, and monsoon prediction. The pattern across all five is consistent: SHAP identifies a small number of dominant physical features that match domain expert intuition. Temporal features (hour of day, day of year) and lagged values of the target variable consistently receive high importance. This alignment with domain knowledge is treated as validation of the attribution method, but it raises a question the papers do not fully address: if attributions merely confirm what domain experts already know, what value do they add?
The answer, from Kost et al., is that the value is in quantification, not discovery. Knowing that GHI is important is not new; knowing that its dominance index is 0.365 and removing it costs only 0.009 in R² is actionable.
Healthcare and medical imaging (most sensitive)
Four healthcare applications appear, ranging from chronic kidney disease risk prediction (Hina et al. [3], using SHAP) to whole-slide image analysis (Vu et al. [4], using Contrastive Integrated Gradients) and ECG interpretation (van der Valk et al. [5], using VAE disentanglement). The healthcare context imposes requirements that the energy papers do not face: regulatory oversight, the need for causal (not just correlational) explanations, and the requirement that explanations be interpretable by clinicians, not data scientists.
The healthcare papers also reveal a gap. None evaluates whether the provided explanations actually improve clinical decision-making. The assumption that more explainable models lead to better clinician decisions remains untested in the reviewed literature. This is not merely a gap in the papers reviewed here; it reflects a structural limitation of the attribution evaluation field as a whole. User studies are expensive, domain-specific, and difficult to publish in ML venues. Until the research community incentivises deployment-stage evaluation, claims that attribution methods improve decision-making will remain unsupported by direct evidence.
Finance and cryptocurrency (most challenging)
Two papers apply SHAP to financial time series (cryptocurrency and stock price forecasting). The short-term, high-noise nature of financial data makes attribution fundamentally harder than in physical domains. Feature importance rankings are less stable; small changes in input can produce large changes in attributions; and the non-stationary nature of financial markets means that feature importance itself is time-dependent. These papers validate SHAP’s ability to produce some attribution, but do not establish its reliability for financial decision-making.
A deeper issue is that financial attribution faces a ground-truth problem that even synthetic benchmarks cannot fully address. In energy forecasting, the physical relationship between irradiance and solar power output provides a natural validation signal. In finance, the data-generating process is itself shaped by human behaviour, which is not decomposable into independent feature contributions. An attribution method that assigns importance to a technical indicator in a price prediction may be correct relative to the model but meaningless relative to the actual market dynamics the model approximates. This does not make financial XAI useless, but it means practitioners must be correspondingly more cautious about interpreting attributions as explanations of real-world phenomena.
Geoscience and remote sensing (scalability test)
Two papers apply SHAP at scale to spatiotemporal Earth observation data: European summer wildfires (24 features, continental scale) and coastal land subsidence (InSAR data). These demonstrate that SHAP can be deployed on realistic spatial scales, but the computational cost of Shapley-value approximation becomes a practical concern at this scale.
Cross-domain patterns
| Domain | Attribution value | Key challenge | Maturity |
|---|---|---|---|
| Energy/climate | Quantifying known drivers | Temporal dependencies | High |
| Healthcare | Regulatory compliance | Causal necessity | Medium |
| Finance | Signal in noise | Instability | Low |
| Geoscience | Scalable analysis | Computational cost | Medium |
Lessons from the Surveys
Four surveys in the selection provide the broader context within which the methodological papers sit.
Ullah et al. (2025) [6] review 155 XAI papers and establish taxonomy dimensions useful for any practitioner designing an XAI strategy. Their key finding: the field skews toward image domains and gradient-based methods, while tabular and time series (the most common production formats) are underserved. A practitioner building a tabular model cannot rely on the field’s default recommendations.
Laato et al. (2022) [7] systematically review how to explain AI systems to end users and find that most XAI research assumes a technically literate audience. The explanation formats studied rarely match non-expert stakeholder needs. Deploying an attribution method is not the same as providing an explanation: the output must be translated into a stakeholder-appropriate format, and that translation is itself a design problem.
Preet et al. (2025) [8] provide a pedagogical survey of SHAP useful for team onboarding, covering foundations, implementation variants, and the common pitfall Janzing et al. [9] identified: users do not realise they are choosing between interventional and conditional Shapley values.
Mitchell et al. (2019) introduce Model Cards as a documentation standard. Model Cards are complementary to feature attribution: attribution explains individual decisions, while Model Cards explain the model as a whole.
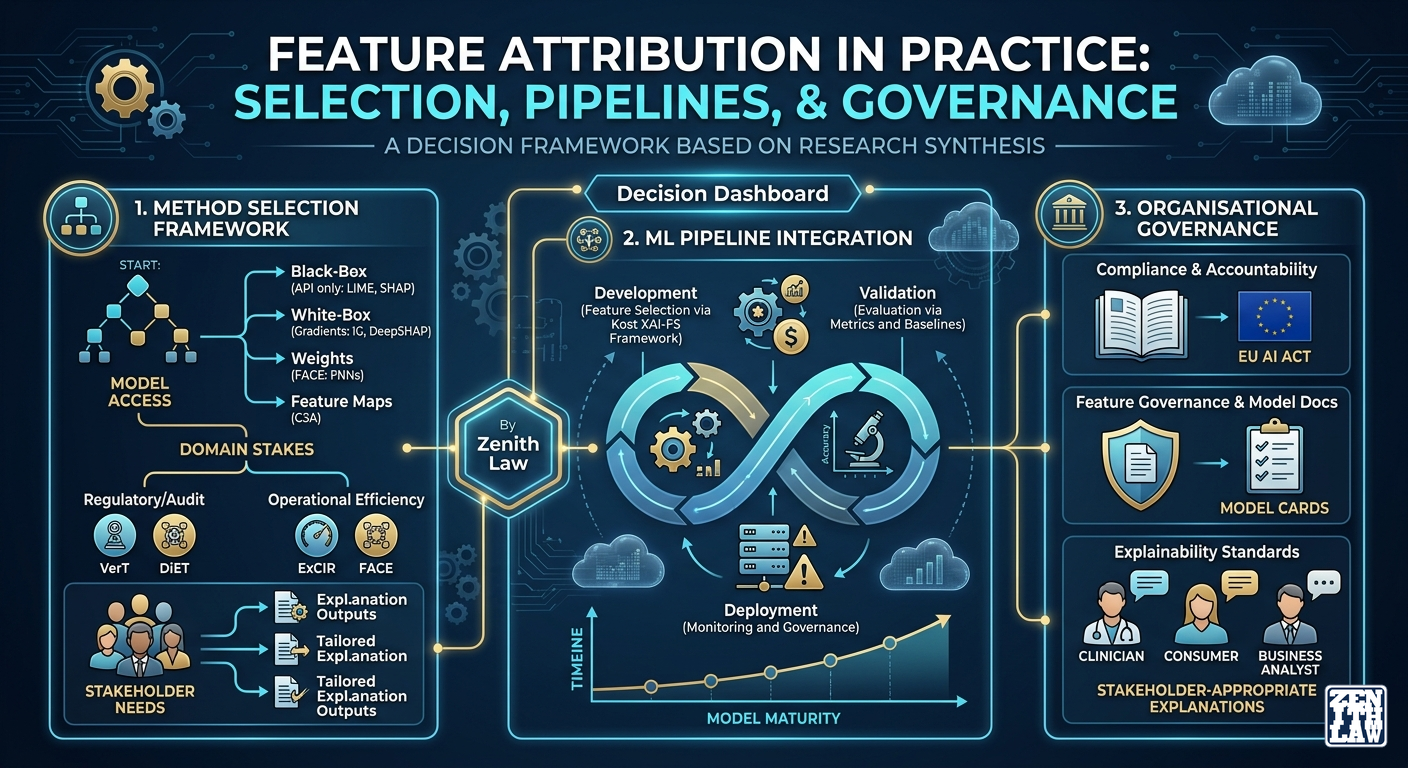
A Decision Framework for Attribution Method Selection
If I were advising a team starting their XAI journey today, I would tell them to start with the decision framework below and budget at least as much for evaluation as for explanation generation. Drawing on all 15 core papers, the domain applications, and the surveys, I propose a structured decision framework organised by three questions.
Question 1: What model access do you have?
| Access level | Available methods | Limitation |
|---|---|---|
| Black-box (API only) | LIME, SHAP (KernelSHAP), GAPS, MOFAE | Cannot use FACE, ExCIR, or C3A |
| Gradients (white-box) | Integrated Gradients, Higher-Order IG, SHAP (DeepSHAP) | Requires differentiable model |
| Weights (white-box) | FACE | FNN architectures only |
| Feature maps (white-box) | C3A | FSL models only |
| Internal structure (white-box) | Decision-path inspection | Tree models only |
Question 2: What does your domain require?
| Domain requirement | Preferred approach | Methods to consider | Methods to avoid |
|---|---|---|---|
| Causal explanation | Causal SHAP (if < 30 features), ExCIR for awareness | Causal SHAP, ExCIR | Standard SHAP, LIME |
| Regulatory audit | Verifiable attribution, documentation | VerT-adapted models + Model Cards | Any unverified post-hoc method |
| Low-latency deployment | FACE (if FNN), ExCIR (global) | FACE, ExCIR | MOFAE, Higher-Order IG |
| Human-interpretable output | Contrastive attribution | C3A, contrastive SHAP | Higher-order (complexity) |
| High-dimensional input | Standard SHAP or LIME | KernelSHAP, LIME | Methods requiring feature maps |
Question 3: What evaluation standard applies?
- Research publication: Use at least two evaluation paradigms (e.g., model-centric + data-centric). Report results across multiple datasets. Follow Dehdarirad [10] ‘s multi-factorial approach by stratifying results by evidence type or class.
- Production deployment: Supplement automated metrics with human evaluation on a representative sample. Use Moreira et al. [11] ‘s decision-path inspection for any tree-based model.
- Regulatory compliance: The verification impossibility is a live compliance risk. Consider Model Cards for model-level documentation and accept that individual prediction explanations from black-box models cannot be independently verified.
Ten Practical Lessons from This Series
-
Do not trust a single attribution you cannot cross-validate. The impossibility result applies to individual explanations. Aggregate statistics across many predictions are more reliable.
-
Know your Shapley variant. If you use SHAP, you must know whether your implementation uses interventional or conditional expectations. The difference is not an implementation detail; it changes what the scores mean.
-
Exact attribution is not a luxury; it is a standard. For feedforward networks, FACE [16] shows that exact attribution is computationally cheaper than approximation. If your architecture supports it, use it.
-
Feature interactions will be invisible unless you look for them. First-order attribution methods miss interactions by construction. For high-stakes settings, supplement first-order with higher-order or interaction-aware analysis.
-
Evaluation metrics are not interchangeable. Each metric captures a different aspect of explanation quality. Triangulate across paradigms and acknowledge what each metric misses.
-
Correlation is not causation, even in attribution. Causal SHAP [12] and ExCIR [21] offer different responses to this problem. Choose based on whether your use case requires causal claims or can tolerate correlational awareness.
-
Attribution is a design-stage tool, not just a post-hoc one. Kost et al.’s XAI-FS shows that attribution can guide feature selection, monitor dominance, and manage acquisition costs well before a model reaches production.
-
Domain alignment validates but does not substitute for rigour. Alignment with domain expert intuition is reassuring but not sufficient. Systematic evaluation remains necessary even when attributions look right.
-
Explainability does not equal a good explanation. The attribution output must be translated into a format appropriate for the stakeholder. The field’s default outputs (heatmaps, bar charts) are poorly suited for non-technical audiences.
-
The field is converging on conditional guidance. There is no universal best attribution method. The papers in this series converge on a framework of conditional recommendations: the right method depends on model architecture, domain stakes, evaluation standard, and stakeholder needs.
Questions on Attribution in Practice
Should I use SHAP or LIME as my default?
The evidence in this series shows both have known failure modes. SHAP conflates correlation with causation (Janzing, Ng [12]). LIME underperforms on time series (Troncoso-García [13]). Use the decision framework above to select based on your specific constraints, and always validate with at least one metric from a different paradigm.
How should attribution be integrated into an ML pipeline?
At three points: (1) feature selection stage (Kost’s XAI-FS approach), (2) model validation stage (evaluation against domain expert baselines), (3) production monitoring stage (tracking attribution stability under distribution shift). Production monitoring for attribution drift is analogous to data and concept drift monitoring: track the rank correlation between current and baseline feature importance distributions, and alert when it drops below a threshold. Most current practice only addresses the second stage.
What should I tell a regulator about my explanations?
Be honest about what they cannot do. Standard post-hoc explanations from black-box models cannot be verified for individual cases (Bhalla [14]). They are aggregate statistical summaries, not guarantees of model behaviour. If a regulator requires verifiable explanations, you need either an inherently interpretable model or a VerT-adapted model.
How much should I invest in attribution infrastructure?
Proportional to the cost of an incorrect explanation. For a product recommendation system, lightweight SHAP or LIME may suffice. For a medical diagnostic aid, invest in stronger methods (FACE or Causal SHAP), multi-paradigm evaluation, and stakeholder-specific explanation formats.
What is the single most important thing a practitioner should do?
Triangulate. Do not rely on a single attribution method, a single evaluation metric, or a single validation dataset. The evidence in this series consistently shows that results are conditional on choices that are easy to overlook when using a single method.
Conclusion
The series supports a convergent conclusion: responsible attribution requires accepting that the field’s ambition exceeded its foundations. The response is not abandonment but specialisation. Practitioners who understand the specific constraints of their domain, model, and regulatory context will produce more reliable attributions than those who deploy a general-purpose method and trust its output.
Each new method comes with sharper applicability conditions: exactness for FNNs only, causal discovery under sufficiency assumptions, correlation awareness at the cost of causal claims. This is a sign of a field maturing. The practitioner’s best strategy is to be informed about the limits, rigorous in evaluation, and honest with stakeholders about what attribution can and cannot guarantee.
Concludes a series on feature attribution, explainability, and interpretability. Technical and educational content. Not legal, regulatory, or procurement advice. Claims bounded to the cited papers’ own reported results unless explicitly stated otherwise. Organisational deployment decisions should be reviewed under applicable professional and regulatory obligations.
Technical Appendix
Appendix Table of Contents
- Author and Source Credibility
- Corpus Reviewed
- Citability Snapshot
- Technical Term Definitions
- Full Series Reference Map
- Evidence Maturity Map
Author and Source Credibility
The primary paper for this article (Kost et al.) appears in Energy and AI (Elsevier), a reputable domain-specific journal. The four surveys appear in diverse venues: a top-tier computing survey journal (Ullah, ACM Computing Surveys), an information systems journal (Laato, Internet Research), an IoT applications conference (Preet, IEEE IoT-SIU), and a famous workshop paper at ACM FAT* (Mitchell). Mitchell et al.’s Model Cards paper, while not archival, is one of the most influential works in the broader AI governance literature.
Corpus Reviewed
- Kost, L., Lier, S.K. and Breitner, M.H. (2025) ‘An explainable artificial intelligence feature selection framework for transparent, trustworthy, and cost-efficient energy forecasting’, Energy and AI, 22, 100648. doi:10.1016/j.egyai.2025.100648.
- Ullah, N. et al. (2025) ‘Explainable artificial intelligence: importance, use domains, stages, output shapes, and challenges’, ACM Computing Surveys, 57(4), pp. 1–36. doi:10.1145/3705724.
- Laato, S. et al. (2022) ‘How to explain AI systems to end users: a systematic literature review and research agenda’, Internet Research, 32(7), pp. 1–31. doi:10.1108/INTR-08-2021-0600.
- Preet, S. and Chhabra, G. (2025) ‘Exploring SHAP: a deep dive into feature attribution for explainable AI’, in 2025 5th International Conference on Internet of Things: Smart Innovation and Usages (IoT-SIU). IEEE. doi:10.1109/IOT-SIU65919.2025.11402705.
- Mitchell, M. et al. (2019) ‘Model cards for model reporting’, in Proceedings of the Conference on Fairness, Accountability, and Transparency (FAT 2019)*. ACM.
Full Series Reference Map
| Article | Date | Papers covered | Focus |
|---|---|---|---|
| 1: Foundations | 10 Jun | Causal critique (2020) [9], Verifiability (2023) [14], DiET (2023) [15] | Theoretical limits |
| 2: Methods | 14 Jun | FACE [16], Higher-Order IG [17], GAPS [18], MOFAE [19] | New computation |
| 3: Evaluation | 18 Jun | WAE [20], RExQUAL [13], Counterfactual [11], Dehdarirad [10] | Metrics |
| 4: Dependency | 22 Jun | Causal SHAP [12], ExCIR [21], C3A [22] | Correlation-causation |
| 5: Practice | 26 Jun | Kost XAI-FS [1], surveys, domain apps | Deployment |
Technical Term Definitions
- Herfindahl-Hirschman Index (HHI)
- An economic concentration measure adapted by Kost et al. to quantify how concentrated feature importance is across the feature set, with higher values indicating dominance by fewer features.
- Distribution shift
- A change in the data distribution between training and deployment that can cause model performance degradation and also change feature importance rankings, requiring ongoing attribution monitoring.
- Stakeholder-appropriate translation
- The process of converting a technical attribution output (feature importance vector, heatmap) into a format appropriate for the intended audience, such as a natural-language explanation or a visual summary.
- Attribution drift monitoring
- The practice of tracking how feature importance rankings change over time in a production system, analogous to data drift and concept drift monitoring but applied to the explanation layer.
Evidence Maturity Map
- Established practice (replicated across settings): (a) SHAP as the dominant attribution method in domain applications; (b) alignment between SHAP-identified important features and domain expert intuition.
- Emerging practice (validated in limited settings): (a) XAI-guided feature selection (Kost, single dataset); (b) causal SHAP for correlation-causation separation (synthetic + biomedical); (c) attribution for cost-aware feature governance.
- Gap (no empirical evidence in reviewed literature): (a) whether explanations improve end-user decision-making; (b) attribution stability monitoring in production; (c) stakeholder-appropriate explanation formats for non-technical audiences.
References
- [1]L. Kost, S. K. Lier and M. H. Breitner, An explainable artificial intelligence feature selection framework for transparent, trustworthy, and cost-efficient energy forecasting, vol. 22, pp. 100648, 2025. doi: 10.1016/j.egyai.2025.100648. Accessed: 26 June 2026.
- [2]M. Mitchell et al., Model Cards for Model Reporting, in Proceedings of the Conference on Fairness, Accountability, and Transparency (FAT* ‘19), pp. 220–229, 2019. doi: 10.1145/3287560.3287596. Accessed: 26 June 2026.
- [3]M. D. Hina, O. Lamouchi, A. Soukane and A. Ramdane-Cherif, SHAP-Based Explanations for Chronic Kidney Disease Risk Prediction: Toward Trustworthy Clinical AI, in 2025 9th International Conference on Computer Science and Artificial Intelligence (CSAI 2025), pp. 660–671, 2025. doi: 10.1145/3788149.3788251. Accessed: 26 June 2026.
- [4]A. M. Vu et al., Contrastive Integrated Gradients: A Feature Attribution-Based Method for Explaining Whole Slide Image Classification, in 2026 IEEE/CVF Winter Conference on Applications of Computer Vision (WACV), pp. 1105–1115, 2026. doi: 10.1109/WACV61042.2026.00123. Accessed: 26 June 2026.
- [5]V. van der Valk, D. Atsma, R. Scherptong and M. Staring, Explainable ECG analysis by explicit information disentanglement with VAEs, 2025. doi: 10.1109/TBME.2025.3631143. Accessed: 26 June 2026.
- [6]N. Ullah, J. A. Khan, I. De Falco and G. Sannino, Explainable Artificial Intelligence: Importance, Use Domains, Stages, Output Shapes, and Challenges, vol. 57, no. 4, pp. 1–36, 2025. doi: 10.1145/3705724. Accessed: 26 June 2026.
- [7]S. Laato, M. Tiainen, A. K. M. Najmul Islam and M. Mäntymäki, How to explain AI systems to end users: a systematic literature review and research agenda, vol. 32, no. 7, pp. 1–31, 2022. doi: 10.1108/INTR-08-2021-0600. Accessed: 26 June 2026.
- [8]S. Preet and G. Chhabra, Exploring SHAP: A Deep Dive into Feature Attribution for Explainable AI, in 2025 5th International Conference on Internet of Things: Smart Innovation and Usages (IoT-SIU), 2025. doi: 10.1109/IOT-SIU65919.2025.11402705. Accessed: 26 June 2026.
- [9]D. Janzing, L. Minorics and P. Bloebaum, Feature relevance quantification in explainable AI: A causal problem, in Proceedings of the Twenty Third International Conference on Artificial Intelligence and Statistics, vol. 108, pp. 2907–2916, PMLR, n.d. Accessed: 26 June 2026.
- [10]T. Dehdarirad, Evaluating explainability in language classification models: A unified framework incorporating feature attribution methods and key factors affecting faithfulness, vol. 9, no. 4, pp. 100101, 2025. doi: 10.1016/j.dim.2025.100101. Accessed: 26 June 2026.
- [11]C. Moreira, Y. L. Chou, C. Hsieh, C. Ouyang, J. Pereira and J. Jorge, Benchmarking Instance-Centric Counterfactual Algorithms for XAI: From White Box to Black Box, vol. 57, no. 6, n.d. doi: 10.1145/3672553. Accessed: 26 June 2026.
- [12]W. Y. Ng, L. R. Wang, S. Liu and X. Fan, Causal SHAP: Feature Attribution with Dependency Awareness through Causal Discovery, in 2025 International Joint Conference on Neural Networks (IJCNN), pp. 1–8, n.d. doi: 10.1109/IJCNN64981.2025.11228295. Accessed: 26 June 2026.
- [13]Á. R. Troncoso-García, M. Martínez-Ballesteros, F. Martínez-Álvarez and A. Troncoso, A New Metric Based on Association Rules to Assess Feature-Attribution Explainability Techniques for Time Series Forecasting, vol. 47, no. 5, pp. 4140–4155, n.d. doi: 10.1109/TPAMI.2025.3540513. Accessed: 26 June 2026.
- [14]U. Bhalla, S. Srinivas and H. Lakkaraju, Verifiable Feature Attributions: A Bridge between Post Hoc Explainability and Inherent Interpretability, in ICML 3rd Workshop on Interpretable Machine Learning in Healthcare (IMLH), 2023. Accessed: 26 June 2026.
- [15]U. Bhalla, S. Srinivas and H. Lakkaraju, Discriminative Feature Attributions: Bridging Post Hoc Explainability and Inherent Interpretability, in Advances in Neural Information Processing Systems, vol. 36, pp. 44105–44122, Curran Associates, Inc., 2023. Accessed: 26 June 2026.
- [16]J. L. Carles-Bou and E. J. Carmona, Achieving faithful explainability in feedforward neural networks through accurately computed feature attribution, vol. 195, pp. 108277, 2026. doi: 10.1016/j.neunet.2025.108277. Accessed: 26 June 2026.
- [17]K. Butler, G. Feng and P. M. Djurić, Higher-Order Feature Attribution: Bridging Statistics, Explainable AI, and Topological Signal Processing, in ICASSP 2026 - 2026 IEEE International Conference on Acoustics, Speech and Signal Processing (ICASSP), pp. 5261–5265, n.d. doi: 10.1109/ICASSP55912.2026.11461829. Accessed: 26 June 2026.
- [18]B. Daley, Q. E. A. Ratul, E. Serra and A. Cuzzocrea, GAPS: Generality and Precision with Shapley Attribution, in 2022 IEEE International Conference on Big Data (Big Data), pp. 5444–5450, n.d. doi: 10.1109/BigData55660.2022.10021127. Accessed: 26 June 2026.
- [19]Z. Wang, C. Huang, Y. Li and X. Yao, Multi-objective Feature Attribution Explanation For Explainable Machine Learning, vol. 4, no. 1, n.d. doi: 10.1145/3617380. Accessed: 26 June 2026.
- [20]Y. Chen and S. Zhang, WAE: An evaluation metric for attribution-based XAI on time series forecasting, vol. 622, pp. 129379, 2025. doi: 10.1016/j.neucom.2025.129379. Accessed: 26 June 2026.
- [21]P. Sengupta, Y. Zhang, F. Eliassen and S. Maharjan, Correlation-Aware Feature Attribution Based Explainable AI, in 2026 International Conference on Advances in Artificial Intelligence and Machine Learning (AAIML), pp. 210–219, n.d. doi: 10.1109/AAIML67890.2026.11498186. Accessed: 26 June 2026.
- [22]L. Chen, P. Hu and Z. Liu, Seeing What Few-Shot Learners See: Contrastive Cross-Class Attribution for Explainability, pp. 1–15, 2026. doi: 10.1109/TNNLS.2026.3672242. Accessed: 26 June 2026.
Continue Reading in This Series
These linked articles extend the same evidence trail and improve navigability for readers and search systems.